
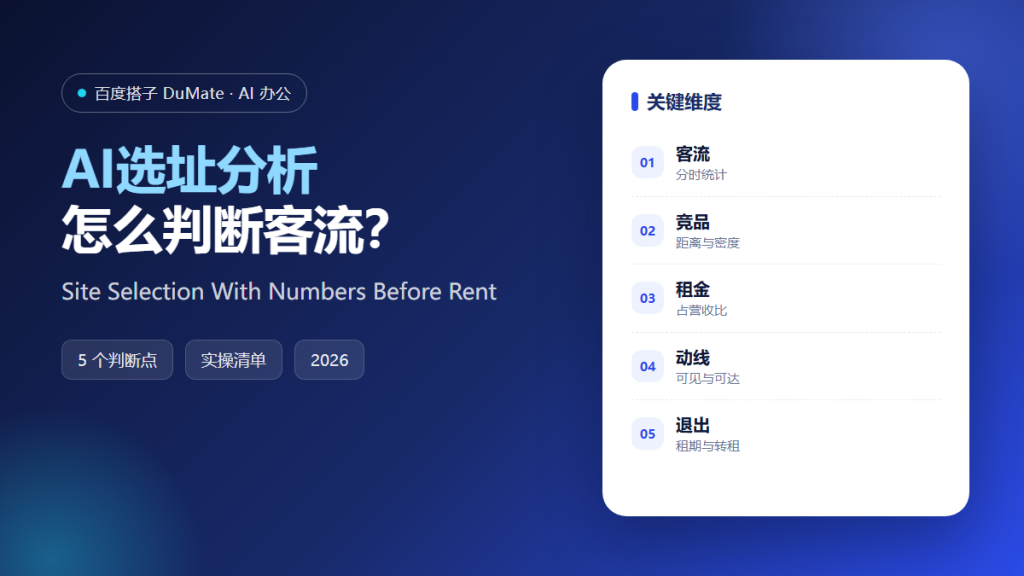
Most retail sites are chosen on a twenty-minute walk and a feeling about the street. The rent is then negotiated as if the feeling were a fact, and the mistake survives for the length of the lease. AI选址分析 replaces the impression with a set of counts that a landlord, a lender, and an operations lead can all inspect.
This guide sets out five steps for AI选址分析, the numbers worth paying for, and the checks that stop a confident forecast from hiding a weak lease.
Key Takeaways
- Define the catchment and the sales threshold before comparing sites.
- AI选址分析 should produce a range, not one forecast.
- Test the rent against the low case, not the average.
- Map competitors and cannibalization on the same base.
- Visit the shortlist at the hours that decide the sale.
Why AI选址分析 Needs a Sales Range, Not a Traffic Count
Footfall is the easiest number to buy and the least useful on its own. A street can carry thirty thousand passers-by a day and still support no store, because most of them are commuting, the doors face the wrong way, or the nearest parking is a ten-minute walk. AI选址分析 begins when that count is split by hour, purpose, and the share of people who could plausibly buy.
A single forecast invites an argument about whether 41,000 or 43,000 is right. A range forces a better question: what rent can this site carry if the low end arrives? Teams that answer it sign better leases, and AI选址分析 gives them a number to bring into the negotiation rather than a claim to defend.
The third reason is memory. A site decision outlives the analyst who made it. When catchment, competitors, spend, and rent ratio are written down, the next team can see why the choice was made and whether the world has changed. Without that sheet, AI选址分析 becomes a slide nobody can audit.
How AI选址分析 Works in Five Steps
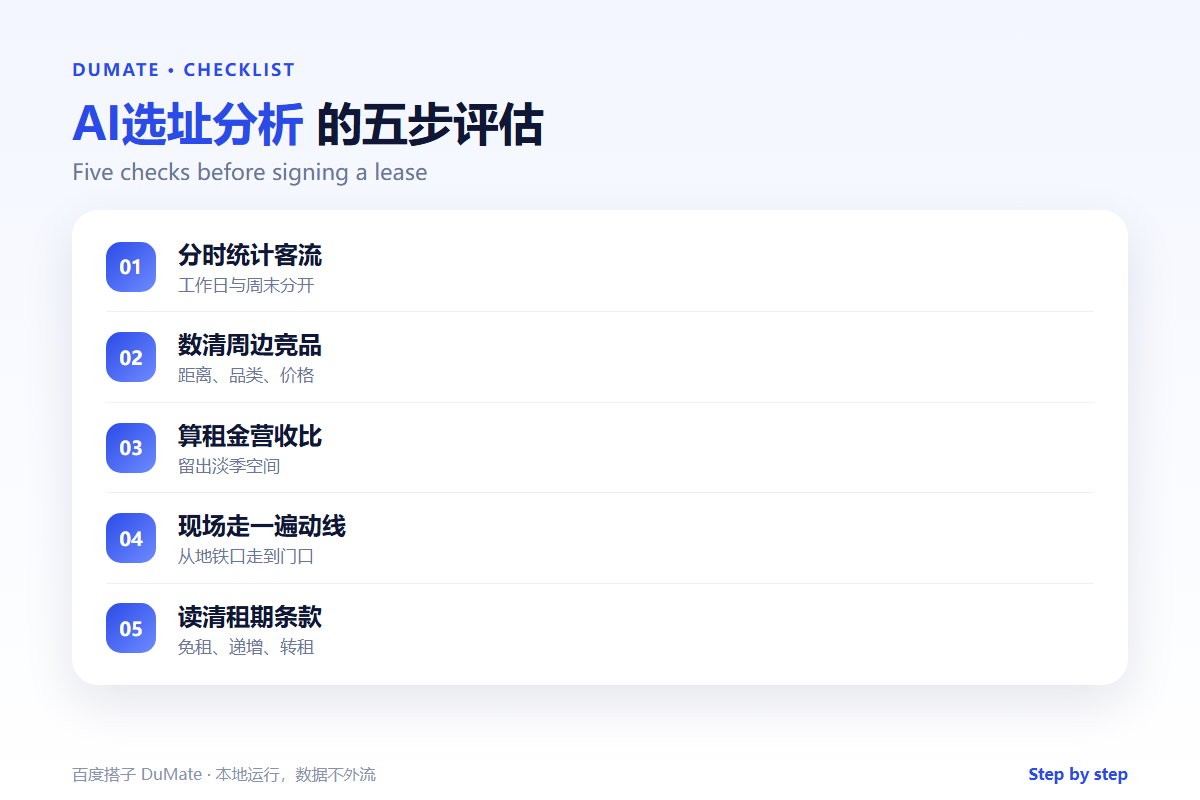
Step 1: Define the catchment and the threshold
Draw the area from which most customers will travel, using drive time or walking distance rather than a circle on a map. Set the monthly sales the site must reach to cover rent, staff, and a modest return. Write both numbers down before looking at any candidate. A threshold chosen after the data arrives is not a threshold, and AI选址分析 will quietly adopt whatever the site produces.
Step 2: Buy counts you can audit
Ask for footfall by hour and by day, resident and worker population, income bands, and the tenant mix of the center. Check the vintage and the method behind each dataset. A count with a known bias is more useful than a precise number with no source. AI选址分析 should keep the source beside every input so a reviewer can challenge it.
Step 3: Map competitors and cannibalization
Plot every competitor in the catchment, including those that sell only part of the range. Then plot your own stores. A new site that takes a third of its sales from a branch two kilometers away has not added a third of the revenue. AI选址分析 makes that transfer visible before the lease rather than after the first quarter.
Step 4: Model a range and stress the rent
Run low, base, and high scenarios with the assumptions in a single table. Change one assumption at a time and watch which one moves the answer most. Then test the low case against rent, service charge, and fit-out cost. If the site only works at the base case, the landlord is being asked to carry the risk.
Step 5: Visit and set a review date
Visit at opening, at lunch, and at closing on two different weekdays. Count people for twenty minutes and compare the number with the dataset. Note vacancies, the anchor tenant’s condition, and where people actually walk. AI选址分析 ends with a signed assumption sheet and a review date ninety days after opening.
A Decision Checklist for AI选址分析
- The catchment follows travel time, not a radius.
- The sales threshold predates the site list.
- Rent is affordable at the low case.
- Competitor and cannibalization maps share a base.
- One named owner signs the assumption sheet.
Where AI选址分析 Fails
It fails when the model is asked to justify a decision already made. AI选址分析 also fails quietly, because a store that opens below forecast is blamed on its manager rather than on the assumptions that produced the number.
- Traffic counted only in daylight hours.
- Rent compared at the base case alone.
- Sales moved from an existing branch and booked as growth.
- No review after opening, so the assumptions never improve.
Before and After
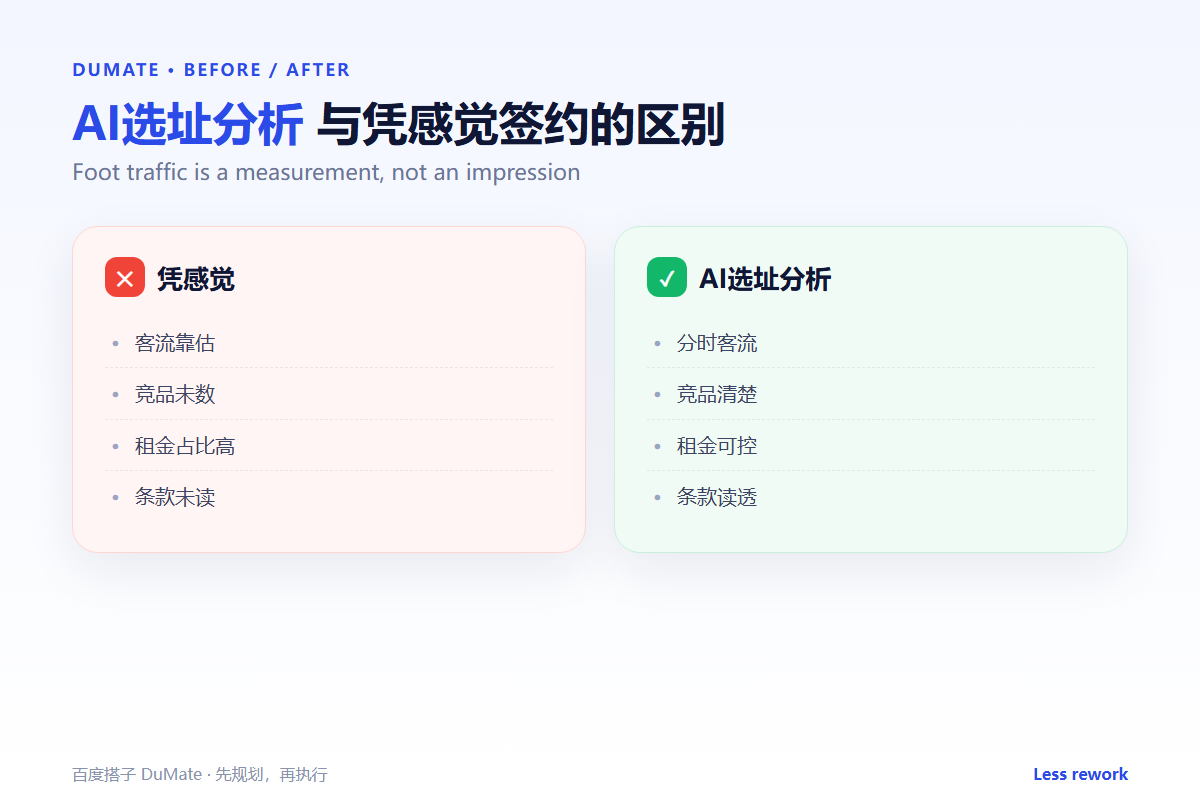
Before, a bakery chain compared four sites on one traffic number and chose the highest count, at a rent equal to 14 percent of forecast sales. The forecast assumed every morning passer-by would buy twice a week. Actual sales reached 61 percent of plan, and the store closed after eleven months.
After, the same team used AI选址分析 to rank sites by the rent each could carry at the low case. They chose the second-highest traffic site at 9 percent of conservative sales and added a delivery counter the data showed was missing. Sales beat the low case by 8 percent in the first quarter, and the assumption sheet cut review time for the next four openings.
FAQ
Does AI选址分析 replace a site visit?
No. It tells you where to look and what to check. The visit confirms whether people walk on the side of the street the model assumed.
How much history is enough?
Two years of footfall, a current competitor list, and income data at catchment level. Missing sources hurt more than missing months.
What rent ratio should we target?
Set it from your own stores at the low sales case. Any site above that ratio is a negotiation, not a plan.
延伸阅读
Site decisions improve when market research to decision turns survey work into a ranked shortlist, sales forecast sets the range a new store must hit, and customer profile describes who walks in. Use inventory forecast to size opening stock and budget planning to carry the fit-out cost. External references: NIST AI Risk Management Framework and ISO/IEC 42001.
评论
还没有评论,来说两句吧。