

AI财务分析 is not a longer version of a dashboard. A dashboard shows that a number moved; analysis explains why it moved and what is likely to happen next. The difference matters because managers cannot act on a chart alone, but they can act on a driver, a comparison, and a clear question.
This article outlines a five-step approach to explaining financial movement, the comparisons that make a number meaningful, and the mistakes that turn analysis into a recital of last month’s totals.
Key Takeaways
- Start with the question, not the report.
- Compare against plan, prior period, and prior year.
- Break movement into volume, price, and mix.
- Separate one-time items from recurring trends.
- End with a decision or a question.
Why AI财务分析 Needs a Driver View
A revenue total is the result of many smaller movements. Price changes, customer count, order frequency, product mix, and discounts all push the number in different directions. AI财务分析 should decompose the total so that the largest driver is visible, rather than describing the total as better or worse than last month.
The second reason is context. A ten percent increase sounds strong until it is compared with a plan that assumed twenty percent. AI财务分析 should place each result against the budget, the prior period, and the prior year, and state which comparison matters for the decision at hand.
Third, analysis must distinguish a trend from an event. A large order in the final week may lift the quarter without changing the underlying run rate. AI财务分析 should isolate one-time items and show the recurring base, so managers do not build next quarter’s plan on a temporary spike. A simple rule is to show the last six periods on one line, so the reader can see whether the change is new or simply seasonal.
How AI财务分析 Works in Five Steps
Step 1: Frame the question
Write the decision the analysis should support. For example: should we increase the marketing budget for the enterprise segment? A clear question keeps the report from expanding into every metric in the ledger.
Step 2: Build the comparison
Show actual, plan, variance, and percentage. Add the prior period and prior year where seasonality matters. AI财务分析 can calculate the bridges, but the analyst should choose which comparisons are relevant.
Step 3: Decompose the movement
Split the change into volume, price, mix, and currency effects. Check that the parts add back to the total. AI财务分析 can produce the bridge chart and identify the line that explains most of the variance.
Step 4: Test the explanation
Ask whether the driver is consistent with operational data. A volume increase should appear in shipments or active customers. A margin gain should be visible in purchasing or pricing records. AI财务分析 can flag a story that does not match the supporting numbers.
Step 5: Write the conclusion
State what happened, why it happened, what is likely next, and what decision is needed. Keep it to one page. AI财务分析 can draft the narrative, but a human must confirm the interpretation and the tone.
‘ alt=’AI财务分析 checklist: question, comparison, drivers, validation and conclusion’ />
A Financial Analysis Checklist
- The decision question is explicit.
- Comparisons include plan and prior year.
- Drivers reconcile to the total.
- One-time items are separated.
- The AI财务分析 report ends with a next step.
Where AI财务分析 Fails
AI财务分析 fails when it produces a fluent explanation for a movement that has not been checked. A plausible story can spread through an organization faster than a correction. It also fails when the report is long on description and short on implication.
- Comparing a month with the wrong baseline.
- Mixing recurring and one-time revenue.
- Explaining a margin change without purchasing data.
- Ending with no decision or owner.
Before and After
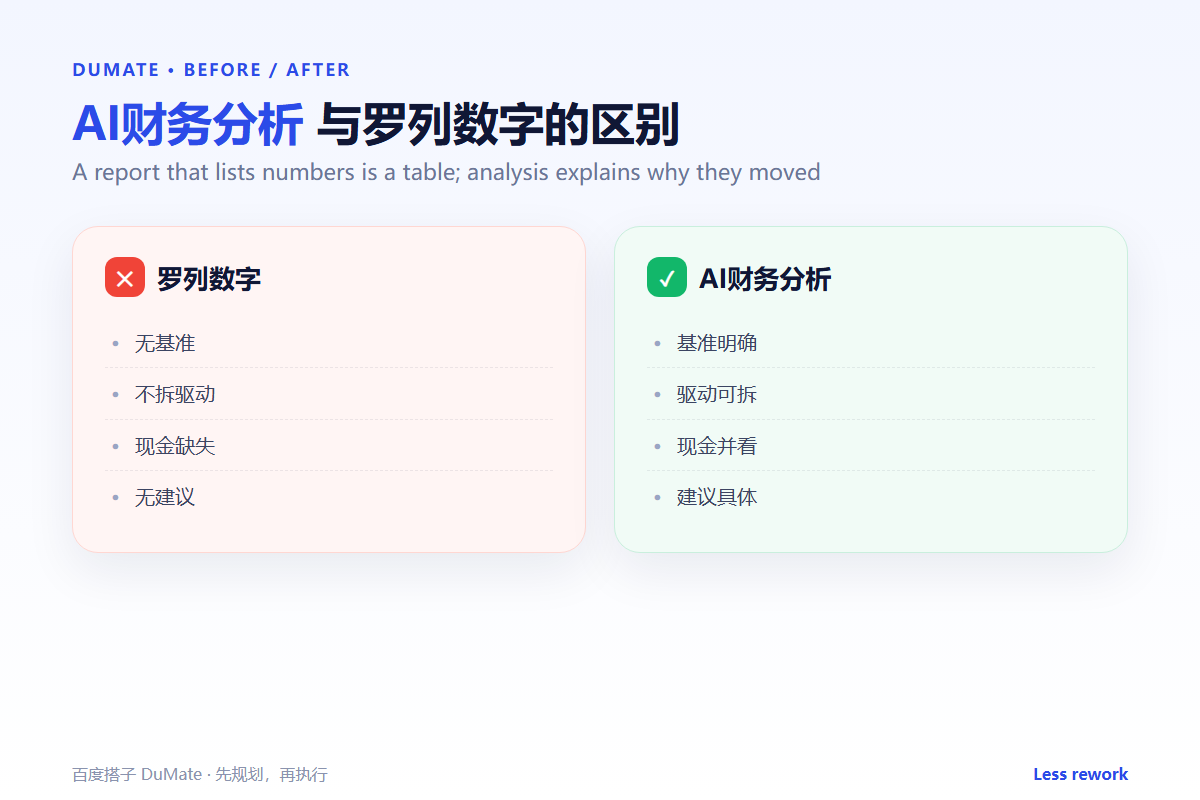
Before, a monthly pack listed every account with a variance and left managers to guess which numbers mattered. After, AI财务分析 produced a one-page bridge showing that a margin decline came from a single supplier price increase, not from discounting, and the team renegotiated the contract before the next quarter.
Analysis earns its place when it changes a decision. Everything else is a report.
Keep the first month simple. One task, one owner, and one weekly review are enough to prove the workflow before it spreads across the team.
Write down what changed after each run. A short note is easier to trust than a memory, and it makes the next improvement obvious.
Review the output before it leaves your desk. A two-minute check catches most of the errors that would otherwise come back as questions.
Keep one example of a good result. New team members learn faster from a concrete reference than from a long explanation.
The first version does not need to be perfect. It needs to be complete enough to review, so the team can see the gaps and fix them in the next round.
Write the review notes in the same place as the work. Notes stored somewhere else are rarely read when the next decision arrives.
FAQ
How many metrics should a report include?
Only those tied to the decision. A focused page with three drivers is more useful than a pack with thirty charts.
Should AI财务分析 explain every variance?
No. Explain the material ones and group the rest. A long list of small explanations obscures the main story.
How do we know the explanation is right?
Check it against operational data and ask the person closest to the driver. A story that cannot be traced to a source is still a hypothesis.
延伸阅读
Start from the statements in financial statements and the plan in budget planning. Demand signals appear in sales forecast and inventory forecast. Classify the underlying data with data labeling. External references: NIST AI Risk Management Framework and ISO/IEC 42001.
评论
还没有评论,来说两句吧。